
Lab Atlas.
A research hub for spatial biology — co-built with an industry expert to solve a real fragmented-data problem.
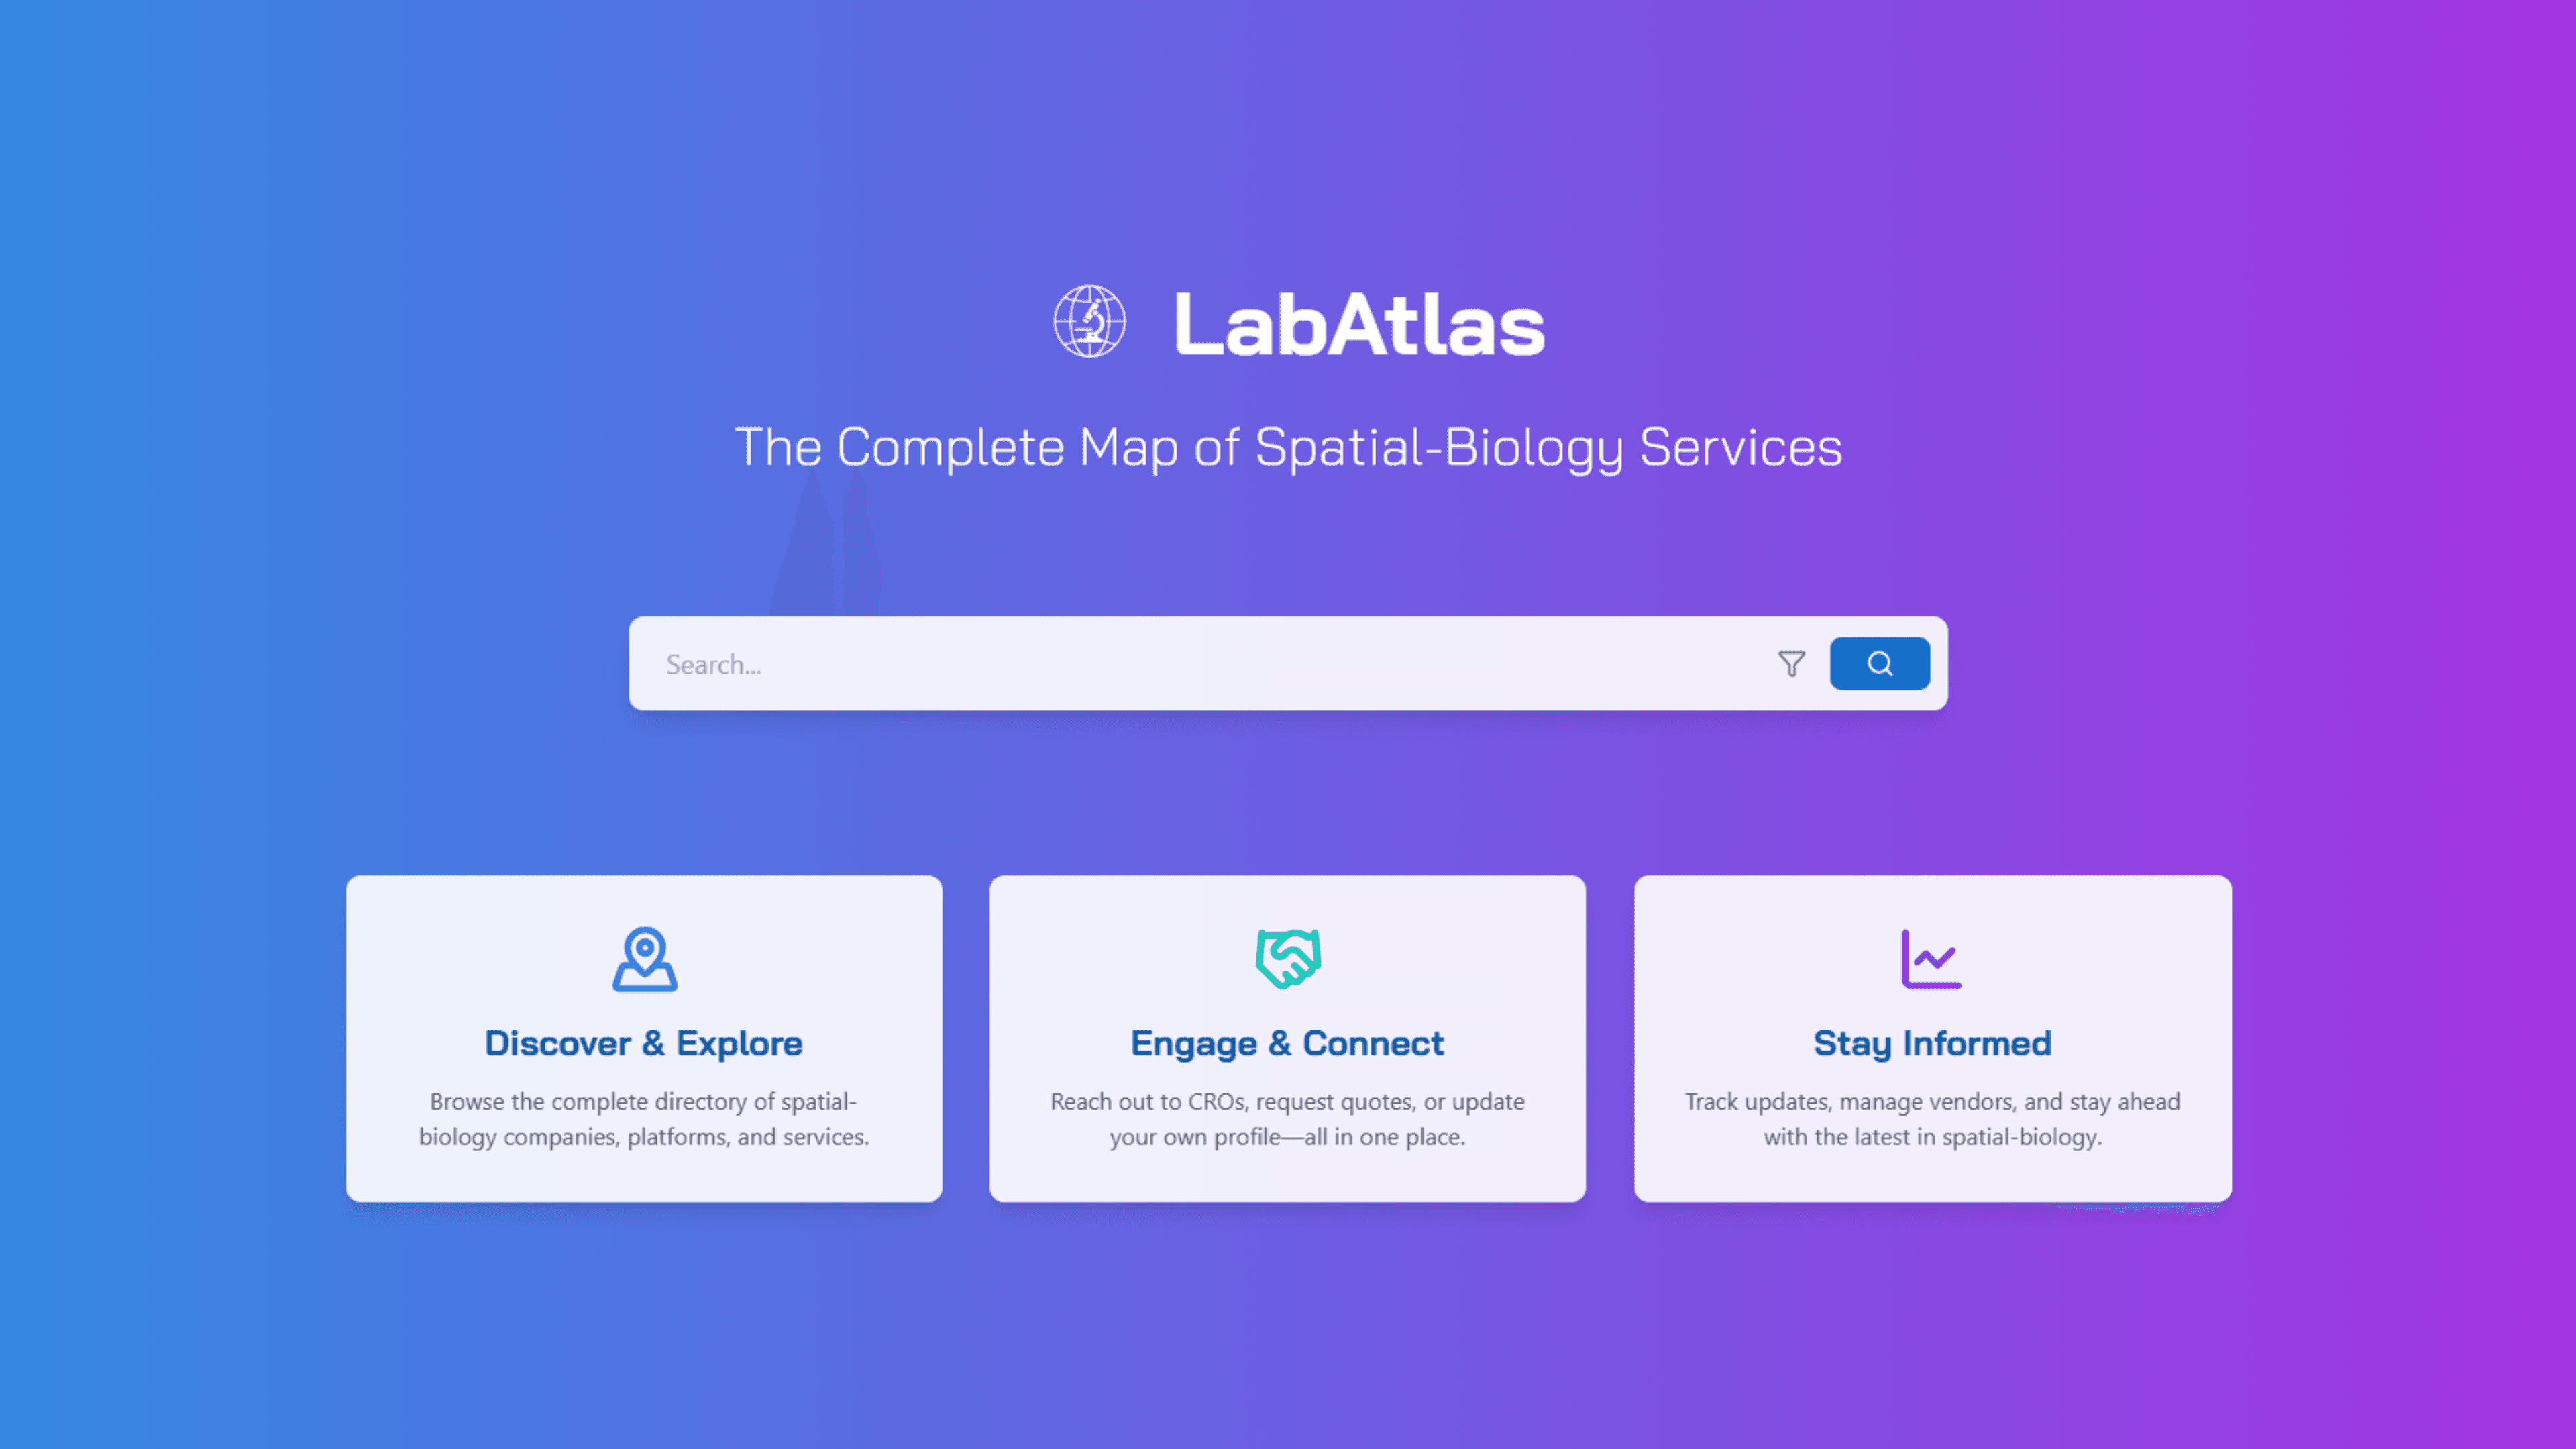
Spatial biology data is fast-moving, fragmented, and impossible to evaluate from the outside.
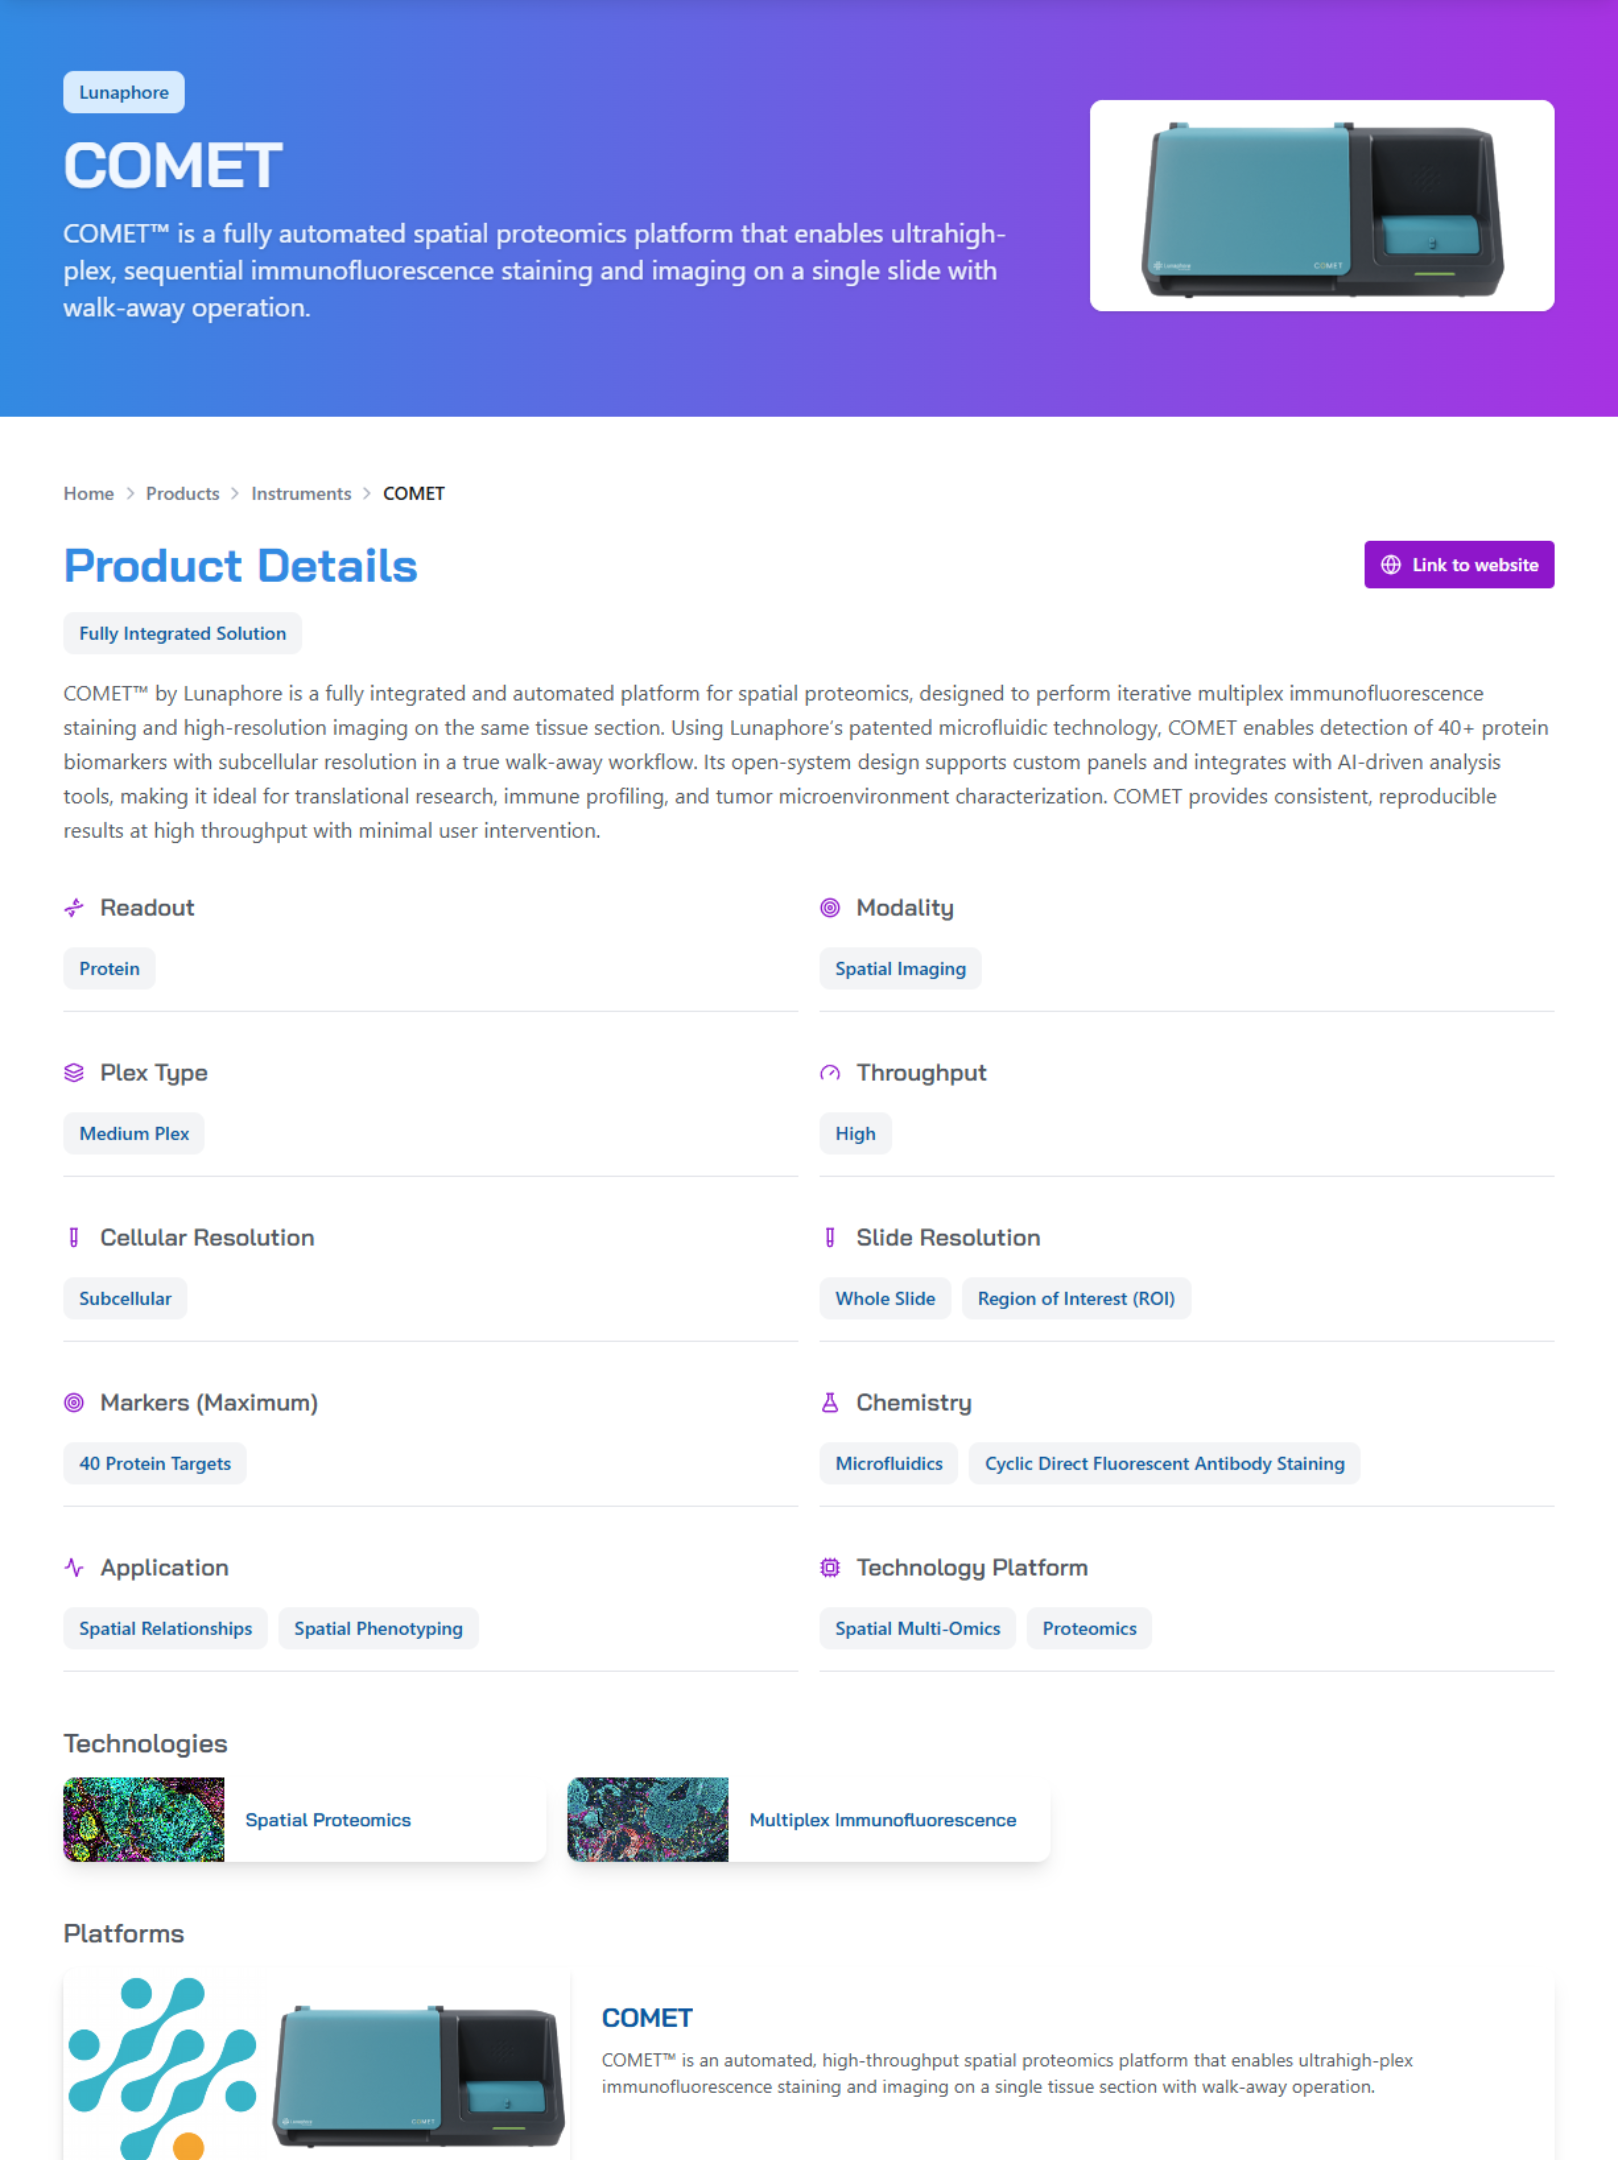
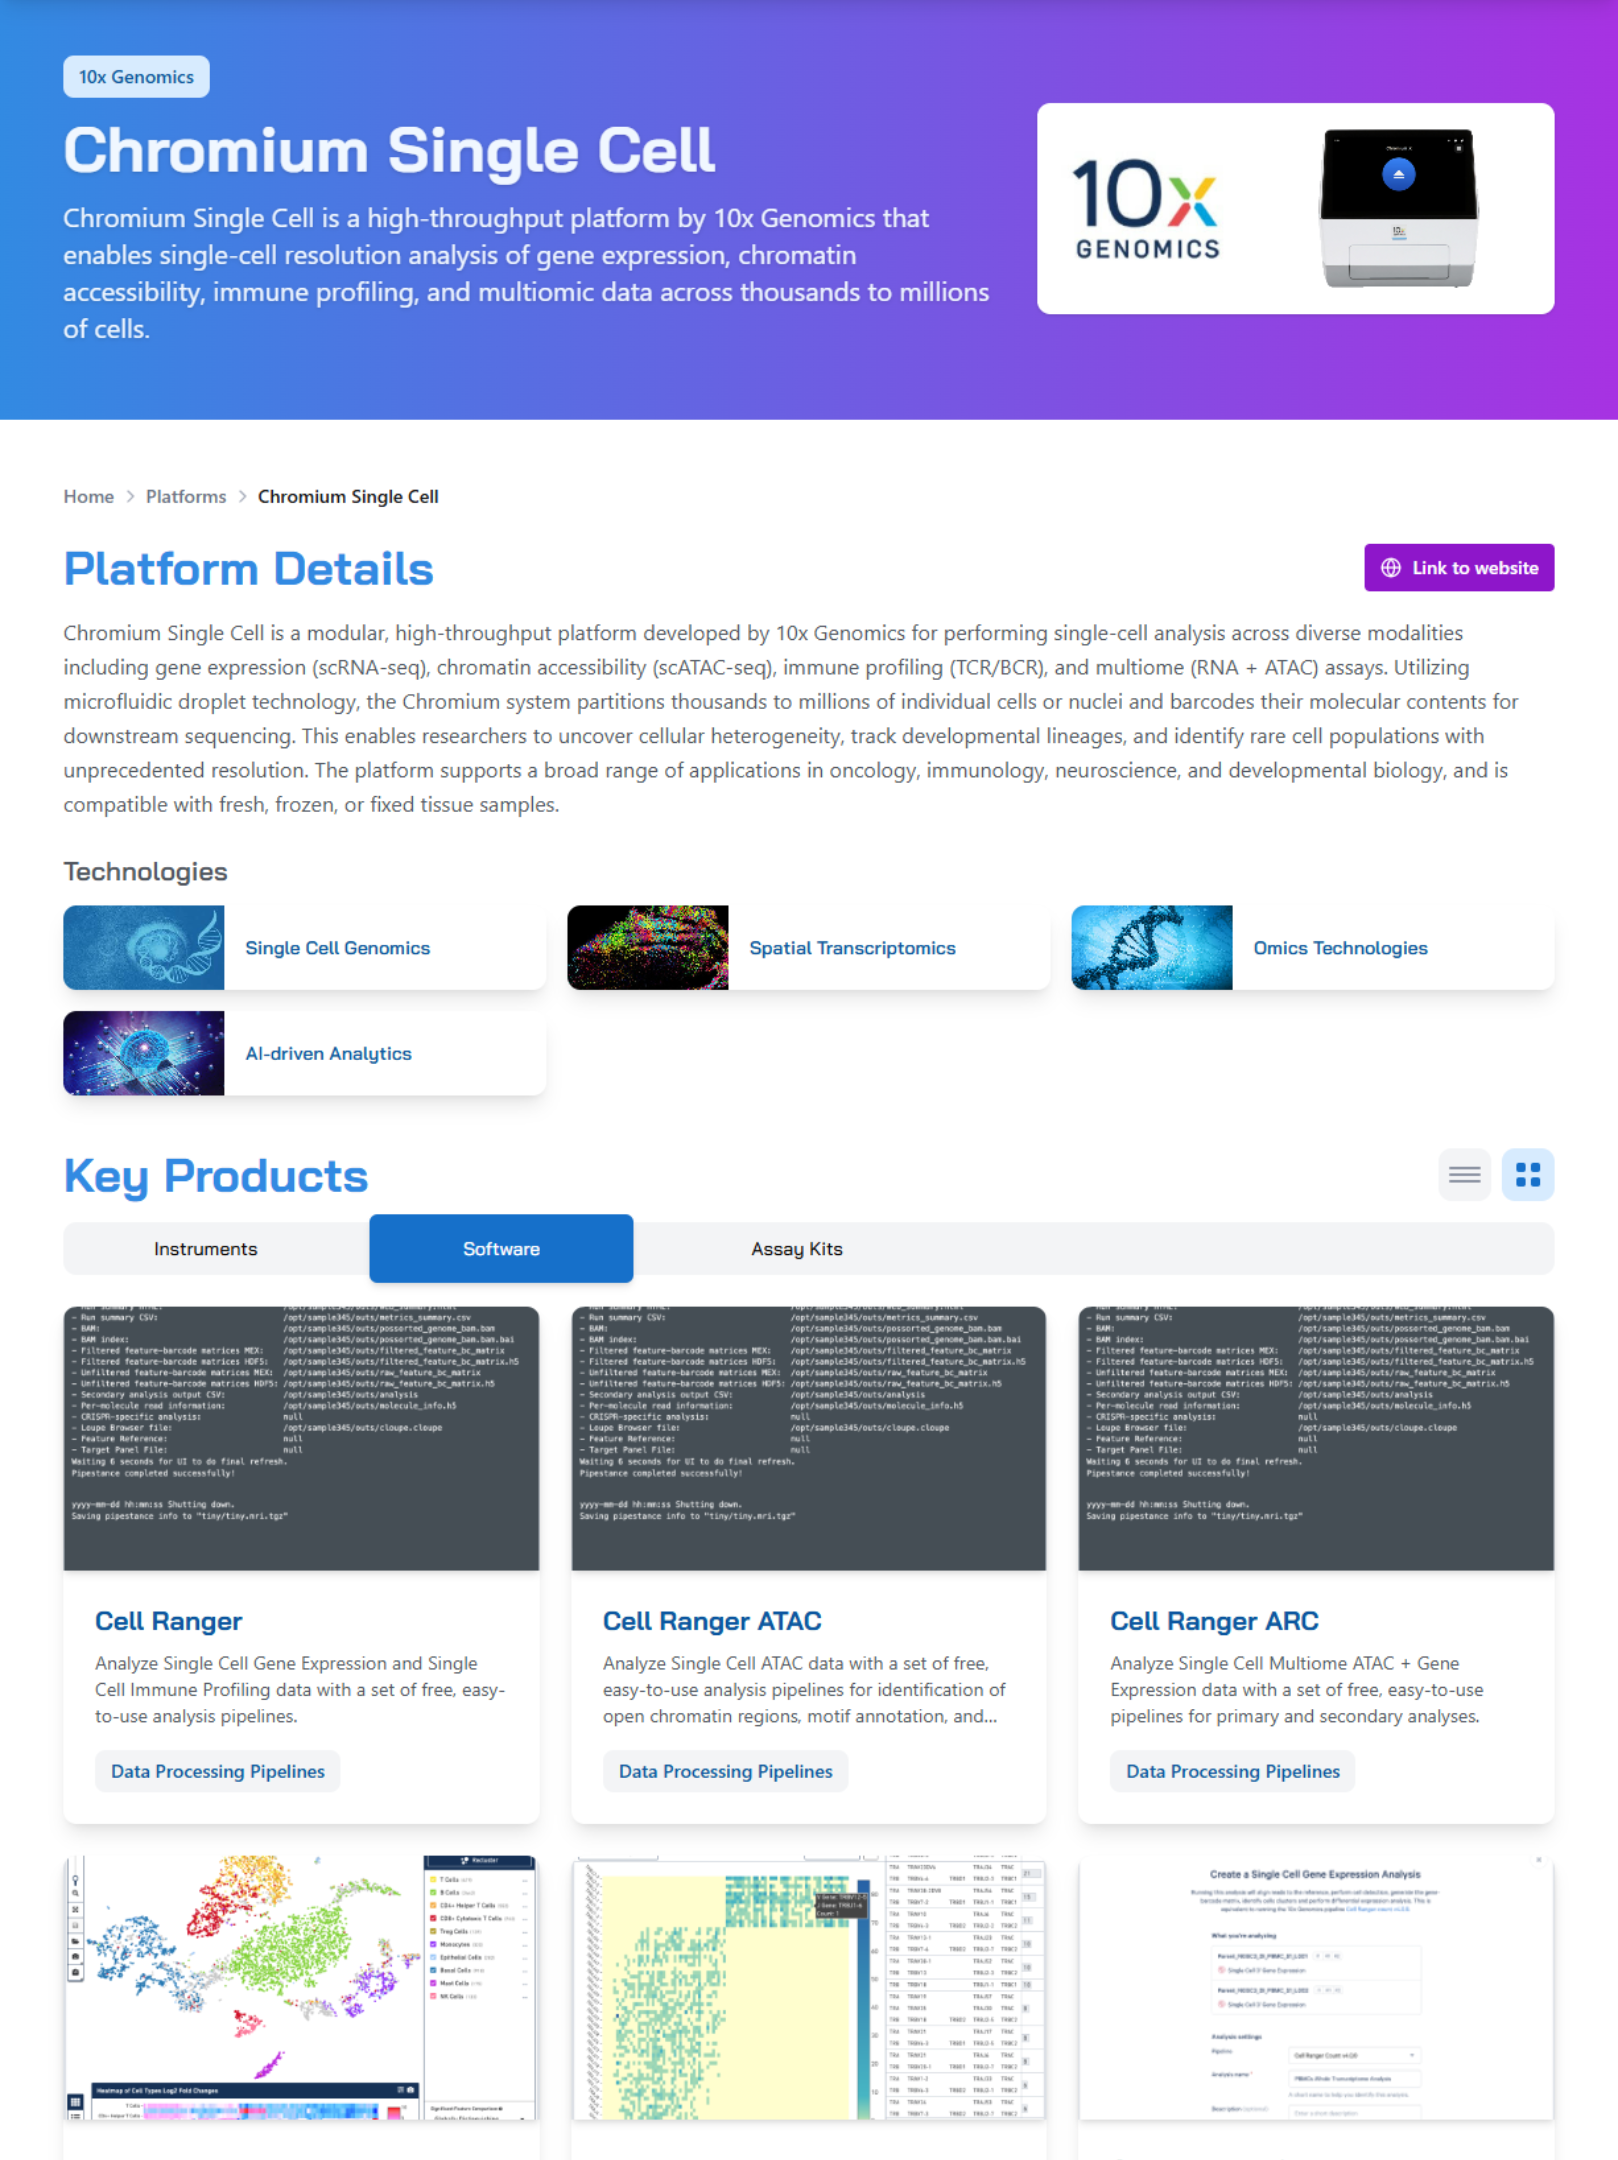
Researchers trying to find and compare CROs, platforms, or tools had no neutral reference — just newsletters, vendor reps, and word of mouth. The domain has five deeply interconnected data types (CROs, staining platforms, imaging instruments, analysis software, and the companies behind them) that all need to be mapped together before any of it becomes useful. Nobody had built that map.
A full taxonomy, a searchable directory, and a multi-step Comparison Wizard.
We mapped the spatial biology ecosystem from the ground up. On top of that we built a searchable platform with multi-axis filtering and a step-by-step Comparison Wizard that walks researchers through their experimental requirements — sample type, analysis type, plex count, resolution, throughput — and returns matched platforms and CROs.
Domain-grounded
Built with a researcher who lived the problem — the taxonomy reflects how scientists actually think about their work, not how vendors market it.
Comparison-first
The Comparison Wizard isn't a filter bar — it's a decision-support flow designed around the questions researchers actually need to answer.
Quality over speed
We chose not to launch with data we couldn't trust. In a domain where a wrong recommendation derails a study, that was the right call.
How it came together
- 01
Identified the problem
My sister Karen Kaye, a spatial biology researcher, described a real gap: no neutral, structured reference for comparing platforms and CROs. We decided to build it together.
- 02
Built the taxonomy
As co-creators, we mapped the full spatial biology ecosystem — five interlinked data types, modeled around the comparison facets that matter to researchers.
- 03
Built the platform
Shipped a working Next.js app with a searchable directory, multi-axis filtering, and a multi-step Comparison Wizard that matches experimental requirements to platforms and CROs.
- 04
Hit the data wall
Manual curation proved unsustainable at scale. Rather than ship a directory researchers couldn't trust, we paused to solve the data pipeline problem properly — exploring agent-assisted collection, automated monitoring, and a human review gate.
Where it goes from here
- 01
Rebuild the data pipeline
The sector taxonomy — platforms, instruments, software — will be maintained by agents crawling vendor sites on a weekly schedule. Vendor data is authoritative and kept current by the vendors themselves. CRO profiles are assembled by cross-referencing that taxonomy, with nothing going live until it passes human review. The trust problem is solvable; we're solving it properly.
- 02
Launch a spatial biology digest
Before the full platform is ready, an AI-assisted weekly digest surfaces what vendors and CROs are announcing across the industry — synthesized into one editorial brief, reviewed before send. It's a way to build an audience and stay active in the industry while the platform is being rebuilt.
- 03
Expand beyond spatial biology
The architecture is domain-agnostic. The same two-layer system that maps spatial biology CROs maps vaccine CDMOs, analytical testing labs, clinical CROs. The spatial biology directory is the first vertical — the proof of concept for a broader CRO intelligence platform. We have active relationships in the industry that will help shape what gets built next.
Series of the Week →
A Netflix-style discovery platform for YouTube's hidden web series.